- Market Overview
- Futures
- Options
- Charts
- Custom Charts
- Spread Charts
- Market Heat Maps
- Historical Data
- Stocks
- Real-Time Markets
- Site Register
- Mobile Website
- Trading Calendar
- Futures 101
- Commodity Symbols
- Real-Time Quotes
- CME Resource Center
- Farmer's Almanac
- USDA Reports
As Traders Brace for a September Slump, Sell T-Bond Futures Here
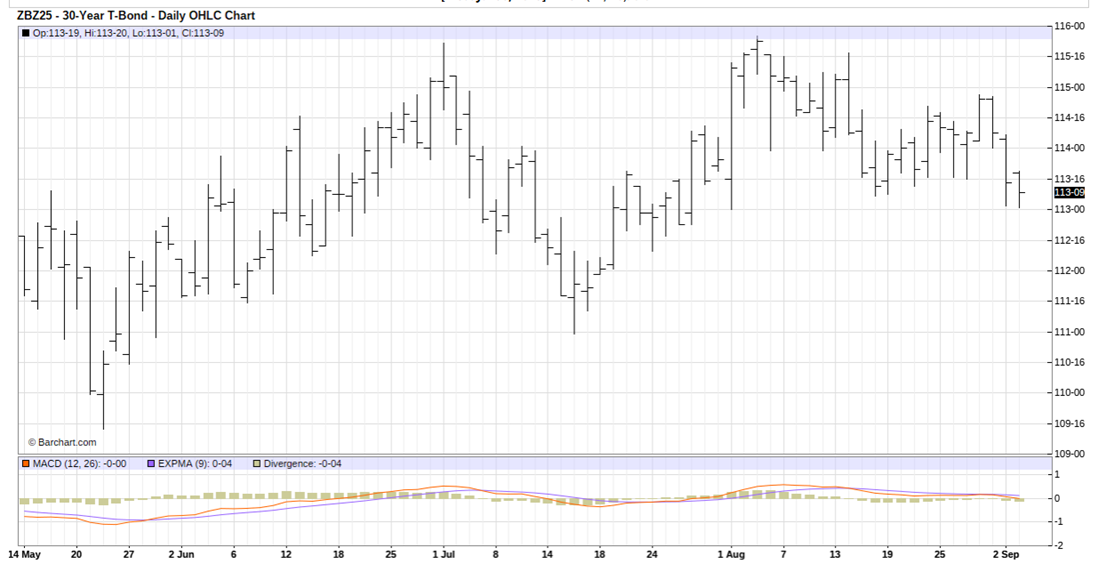
December U.S. Treasury bond (ZBZ25) futures present a selling opportunity on more price weakness.
See on the daily bar chart for December T-Bond futures that a price downtrend line is in place. See, too, at the bottom of the chart that the moving average convergence divergence (MACD) indicator is in a bearish mode as the blue MACD line is below the red trigger line and both lines are trending down. The bears have the overall near-term technical advantage.
Fundamentally, global bond markets this week have already become wobbly due to world inflation and economic growth worries, and also concerns about the independence of the Federal Reserve. History shows the months of September and October are typically the worst-performing months for stock and bond markets.
A move in December T-Bond futures prices below chart support at this week’s low of 113 1/32 would give the bears more power and it would also become a selling opportunity. The downside price objective would be 109 16/32 or below. Technical resistance, for which to place a protective buy stop just above, is located at 114 16/32.
IMPORTANT NOTE: I am not a futures broker and do not manage any trading accounts other than my own personal account. It is my goal to point out to you potential trading opportunities. However, it is up to you to: (1) decide when and if you want to initiate any trades and (2) determine the size of any trades you may initiate. Any trades I discuss are hypothetical in nature.
Here is what the Commodity Futures Trading Commission (CFTC) has said about futures trading (and I agree 100%):
Trading commodity futures and options is not for everyone. IT IS A VOLATILE, COMPLEX AND RISKY BUSINESS. Before you invest any money in futures or options contracts, you should consider your financial experience, goals and financial resources, and know how much you can afford to lose above and beyond your initial payment to a broker. You should understand commodity futures and options contracts and your obligations in entering into those contracts. You should understand your exposure to risk and other aspects of trading by thoroughly reviewing the risk disclosure documents your broker is required to give you.
On the date of publication, Jim Wyckoff did not have (either directly or indirectly) positions in any of the securities mentioned in this article. All information and data in this article is solely for informational purposes. For more information please view the Barchart Disclosure Policy here.